Project #5
Bell Curve
Due 6 April 2005
One of the questions that students often
ask after a difficult exam or at the end of the semester is, "Are you going
to curve the grades?" Generally, the students don't realize what
they are asking. They want to know whether or not their scores or
grades will be adjusted (and generally they are expecting an upward adjustment).
In this assignment, we will see what it really means to grade on the
curve.
The curve in question is the Bell curve
which, under normal circumstances, would be the shape of the distribution
histogram from a random sampling of student's scores for an exam or a course.
The peak of the curve is at the mean; that is the greatest number of students
is expected to have the mean score. The numbers then taper off in
both directions from the mean to form a curve that looks like a bell.
Letter grades are then assigned based on either distribution percentages
or standard deviations. We will choose the standard deviation approach.
The standard deviation for a collection of scores is calculated using the
following formula:
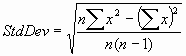 where
n is the number of scores and x is one of the scores. The first summation
is the sum of the squares of each of the scores; the second summation is
the sum of the scores and then that value is squared. For example,
if there are 3 scores, 68, 91, and 77, then the standard deviation is calculated
as the square root of
where
n is the number of scores and x is one of the scores. The first summation
is the sum of the squares of each of the scores; the second summation is
the sum of the scores and then that value is squared. For example,
if there are 3 scores, 68, 91, and 77, then the standard deviation is calculated
as the square root of
(3 * (682+912+772)
- (68+91+77)2) / (3 * 2)
Using the standard deviation approach works
like this. Anyone with a score that is within 1/2 standard deviation
of the mean is assigned a grade of 'C'. Anyone with a score that
is greater than 1/2 standard deviation above the mean but less than or
equal to 1 1/2 standard deviations above the mean is assigned a grade of
'B'. Anyone with a score that is less than 1/2 standard deviation
below the mean but greater than or equal to 1 1/2 standard deviations below
the mean is assigned a grade of 'D'. Anyone with a score greater
than 1 1/2 standard deviations above the mean is assigned a grade of 'A';
and anyone with a score less than 1 1/2 standard deviations below the mean
is assigned a grade of 'F'.
You are given two files, each with student
names and a single score. The file names are frst308.dat and
frst317.dat
Both files use the following form to record a student's score
lastname, firstname
score
There is a comma after the last name and
the first name may be an actual name or for the students that have only
one name (you will see what I mean in frst308.dat) the first name is replaced
with a title or category. All names are a single word - no two-part
last names and no two-part first names.
You are to write a program which does the
following:
-
Prompts for and reads in the name of the data
file containing the names and scores and reads in the name of the report
file to which your program will write most of its results. You may
choose the names for the report files.
-
Reads in the names and scores from the file.
-
Calculates the mean and standard deviation
for the scores. The standard deviation must be calculated
using a function that you write named StdDev which calculates
using the formula given above. You are not allowed to use a standard
deviation library function to calculate the standard deviation (even if
you can find one); however, you may use the square root function from the
cmath library.
-
Then, sort the students into alphabetical
order (along with their scores). This must be done with a function
that you write named Sort.
-
Assign grades (A, B, C, D and F) to the students
using the criteria specified above and write the names, scores, and grades
to the report file. This must be done using a function that you
write named Assign. Each line of the report file should
have the form
firstname lastname
score grade
with one space between the first and last
names and with the scores and grades in neat columns.
-
Finally, display on the screen the mean and
standard deviation for the group.
When you have your program working,
run it using frst308.dat as the data file and print the report file.
Also, capture the screen output by copying and pasting it into another
file. Then, run the program using frst317.dat as the data
file and print the report file. Capture the screen output by copying
and pasting it into the same file as the first run. Print the file
with the two sets of screen output.
Print your source program and copy the
.cpp file to the handin folder on the P drive, after giving it a name similar
to your own.
Extra Credit Opportunities:
Extra credit will be given if the screen
output shows the number of A's, B's, C's, D's, and F's assigned to
the students, e.g. 3 A's, 10 B's, etc. (fairly easy)
Extra credit will be given if the screen
output shows the grade point average for the class. A's are 4
points; B's are 3 points, C's are 2 points, D's are 1 point, and F's are
0 points. (not bad)
Extra credit will be given if the screen
output shows the median score. The median is the middle score
when the scores are sorted lowest to highest. (harder)